About the Science
Disease models: COVID | Contact scaling | Parameter info | Natural herd immunity | Model equations and parameters
Disease models: COVID-19
Mortality data (cumulative) for the United States, acquired from Johns Hopkins, was used to fit the model. (See the model at the bottom of the page.) The model is valid for the original SARS-CoV-2 strain, but does not reflect the increased transmission possible with certain variants.
Published versions of the models or model modifiers can be found in the following papers:
- A primer on using mathematics to understand COVID-19 dynamics
- To mask or not to mask: Modeling the potential for face mask use by the general public to curtail the COVID-19 pandemic
Modifications to the model below were made to the following (in February, 2021):
- For recruitment rate, we only used birth rate based on city population size, and did not add immigration aside from the initial infected people that are added to the map. It was assumed that during a pandemic, immigration would be minimal.
- Daily (continuous) vaccination rate is not a set value for the model; instead, users get to select a specific daily vaccination rate.
- Vaccine effectiveness is not a set value for the model, as effectiveness varies between vaccines; instead, users get to select the effectiveness of the vaccine they use.
- There are three beta values that show effective contact rate for infected individuals who are either asymptomatic, symptomatic, or hospitalized. We modified the rates for asymptomatic and symptomatic individuals using a contact multiplier that scales with city population size. The idea is that asymptomatic individuals and symptomatic individuals will likely contact more people in larger populations. For some symptomatic people, this may be limited to the time they are pre-symptomatic, if they quarantine correctly during their illness, but we assumed that contact would increase a bit in high population cities either way. The hospitalized group did not experience the beta multiplier, as contact within hospitals was reduced very early on in the pandemic (i.e., no visitors for COVID patients). See Contact scaling with population size, below.
- Progression rate (or incubation period) has varied over time with our understanding of COVID-19. Progression rate is based on data from the third wave of the pandemic, via research from Johns Hopkins.
- A disease-induced mortality rate for symptomatic individuals was added, as some people die from the virus without being hospitalized.
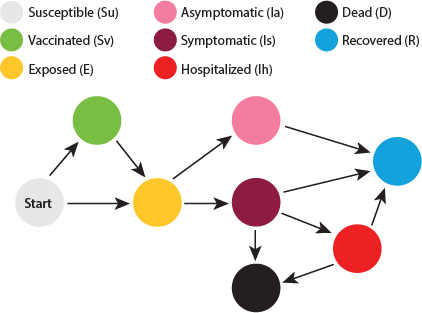
This image was created to help visualize the progression of people between affected groups. Those who are susceptible can either end up being exposed or being vaccinated. A small portion of those vaccinated can lose immunity and end up in the exposed group. Exposed individuals can become symptomatic or asymptomatic. Asymptomatic people recover, while symptomatic people can end up recovered, hospitalized, or dead. Hospitalized people can either end up recovered or dead.
NOTE: Only susceptible individuals are eligible to be vaccinated in this model. Those who are exposed, infected, recovered, or dead cannot be vaccinated. This means that as more people are infected, less of the population can receive a vaccine.
Contact scaling with population size
A linear scaling system was used to create a multiplier that reflects an assumed city density. It takes the minimum city population (10,000) and the largest city population (25 million) and creates a linear multiplier between the two that goes from 0.85 to 1.75. This has the effect of reducing the spread of disease in smaller cities (below 1 on the scale) and increasing the spread of disease in larger cities (higher than 1 on the scale). This helps show the increased contact rates in dense metropolitan areas such as New York City or Shanghai. The contact scaling equation is as follows for a specific population A:
- (population A – minimum population) / (maximum population – minimum population) * (largest scale value – smallest scale value) + smallest scale value.
Using New York’s metro population of around 20 million people as an example, you get:
- (20,000,000 – 10,000) / (25,000,000 – 10,000) * (1.75 – 0.85) + 0.85 = 1.57
So the spread of COVID in New York among asymptomatic and symptomatic people is being multiplied by 1.57 from the base model to show the increase that comes with such a packed metropolitan area.
Parameter info
Vaccination rates
A wide range of daily vaccination rates are out there, depending on when and where you look. Though vaccination rates often start slowly after a vaccine is available, they often ramp up to higher rates as time goes on. As of the end of February, 2021, three months into vaccines being offered in the US, around 0.4 to 0.5% of the US population was being vaccinated every day. With the assumption that it will continue to ramp up a bit more, we selected 0.4% as an overall average for a realistic daily vaccination rate.
Natural herd immunity
When natural herd immunity is selected, we assume that no vaccinations are available; this is the most drastic and costly form of herd immunity, but represents the situation for many diseases before a vaccine can be developed and distributed.
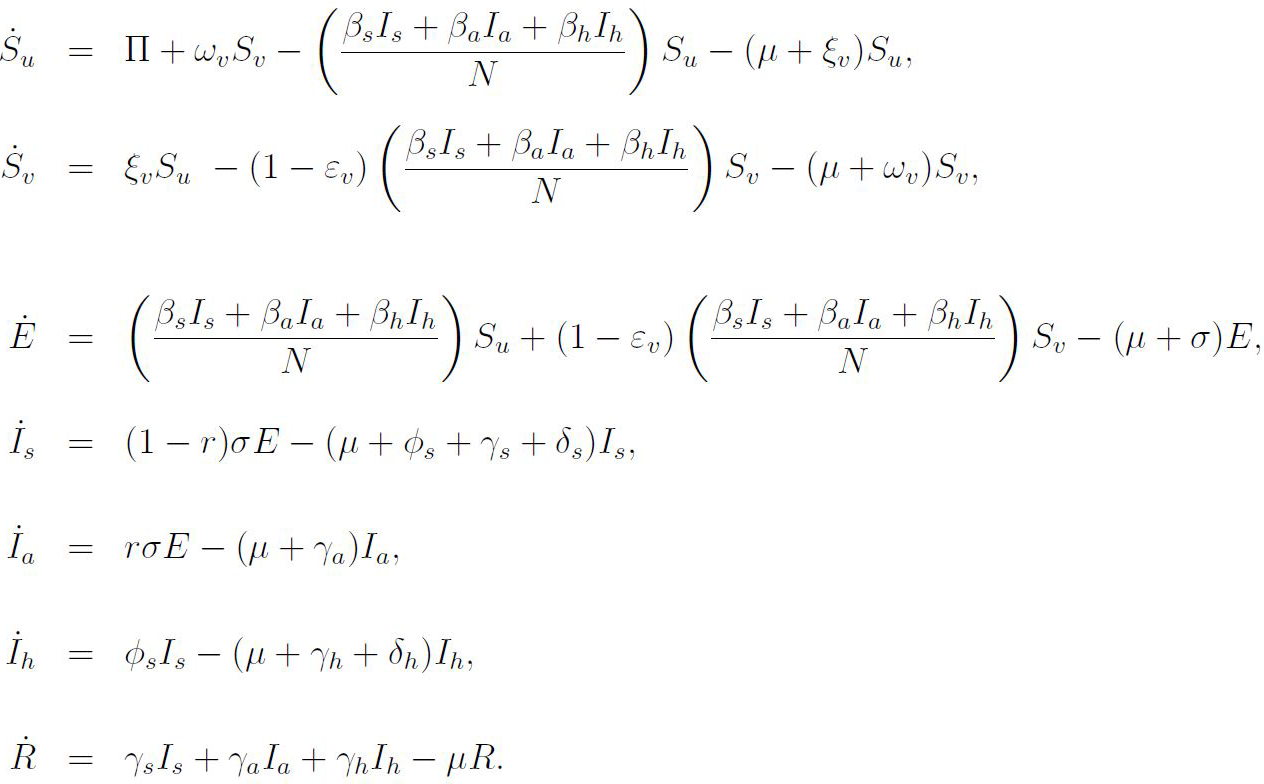
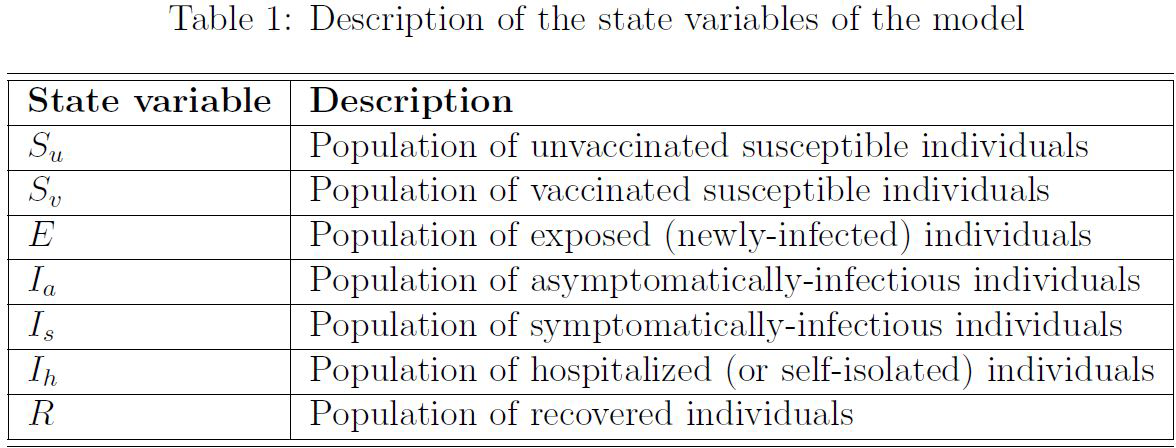
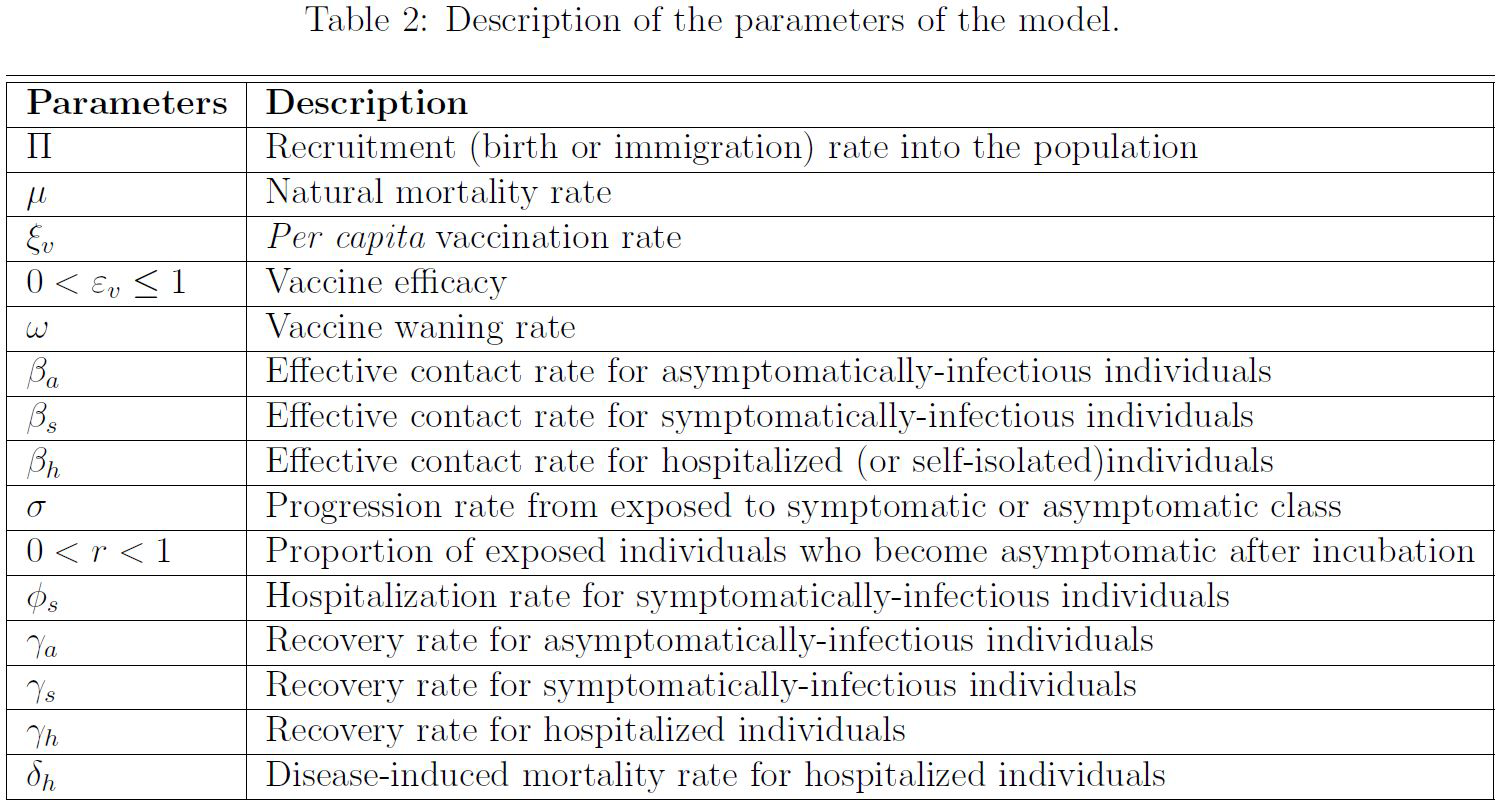
Model equations and parameters
Here is the model we used and the related parameters:
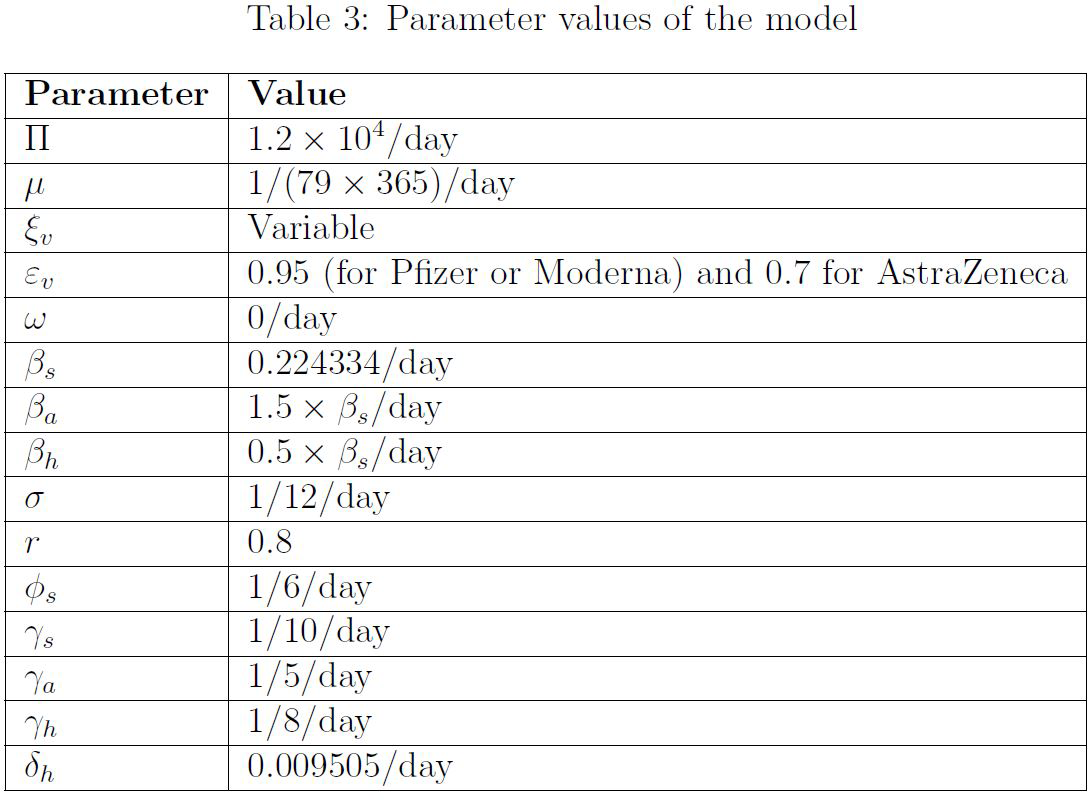
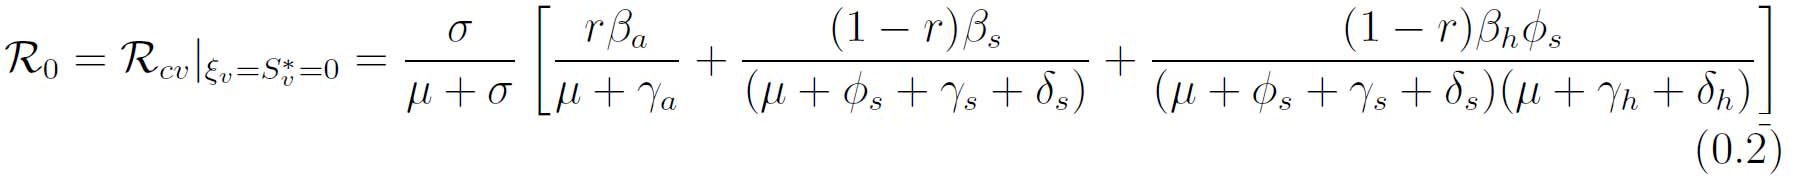
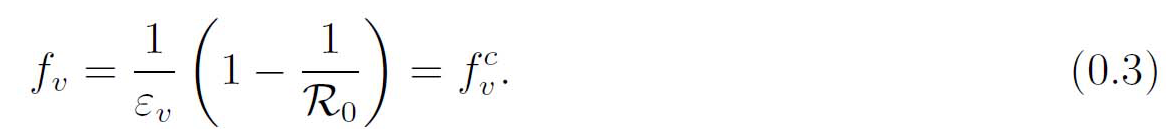
Below are the formulas used to calculate the vaccinated R naught value (RcV, equation 0.1 below), the base R naught value (R0, equation 0.2 below), and the vaccinated herd immunity threshold (fv, 0.3 below).

Learn the latest on the Ask A Biologist COVID-19 vaccines story page.