About the Science
Disease models | Contact scaling | Parameter info | Natural herd immunity | Model equations and parameters
Disease models
Mortality data (cumulative in 2021) for the United States, acquired from Johns Hopkins, was used to fit the model. (See the model at the bottom of the page.) The model is valid for the original SARS-CoV-2 strain, but does not reflect the increased transmission possible with certain variants.
Published versions of the models or model modifiers can be found in the following papers:
- A primer on using mathematics to understand COVID-19 dynamics
- To mask or not to mask: Modeling the potential for face mask use by the general public to curtail the COVID-19 pandemic
Modifications to the model below were made to the following (in February, 2021):
- For recruitment rate, we only used birth rate based on city population size, and did not add immigration aside from the initial infected people that are added to the map. It was assumed that during a pandemic, immigration would be minimal.
- Daily (continuous) vaccination rate is not a set value for the model; instead, users get to select a specific daily vaccination rate.
- Vaccine effectiveness is not a set value for the model, as effectiveness varies between vaccines; instead, users get to select the effectiveness of the vaccine they use.
- There are three beta values that show effective contact rate for infected individuals who are either asymptomatic, symptomatic, or hospitalized. We modified the rates for asymptomatic and symptomatic individuals using a contact multiplier that scales with city population size. The idea is that asymptomatic individuals and symptomatic individuals will likely contact more people in larger populations. For some symptomatic people, this may be limited to the time they are pre-symptomatic, if they quarantine correctly during their illness, but we assumed that contact would increase a bit in high population cities either way. The hospitalized group did not experience the beta multiplier, as contact within hospitals was reduced very early on in the pandemic (i.e., no visitors for COVID patients). See Contact scaling with population size, below.
- Progression rate (or incubation period) has varied over time with our understanding of COVID-19. Progression rate is based on data from the third wave of the pandemic, via research from Johns Hopkins.
- A disease-induced mortality rate for symptomatic individuals was added, as some people die from the virus without being hospitalized.
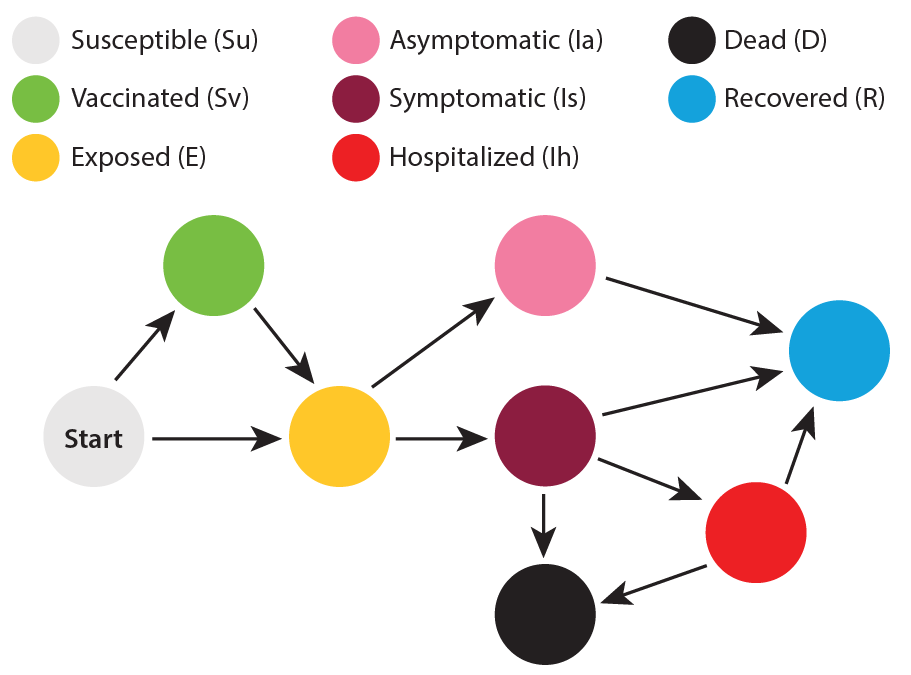
This image was created to help visualize the progression of people between affected groups. Those who are susceptible can either end up being exposed or being vaccinated. A small portion of those vaccinated can lose immunity and end up in the exposed group. Exposed individuals can become symptomatic or asymptomatic. Asymptomatic people recover, while symptomatic people can end up recovered, hospitalized, or dead. Hospitalized people can either end up recovered or dead.
NOTE: Only susceptible individuals are eligible to be vaccinated in this model. Those who are exposed, infected, recovered, or dead cannot be vaccinated. This means that as more people are infected, less of the population can receive a vaccine.
For the flu, the vaccine is considered 45% effective (based on rounding up from the average flu vaccine effectiveness—42%—between 2010 and 2020). The infection death rates for pandemic flu were based on the values from confirmed cases from the 1918 influenza pandemic. The infection death rates for non-pandemic flu were based on the 2018-2019 flu season average cumulative mortality. The vaccination rates for selected cities were based on country rates for each city for H1N1 (2009-2010), as this was one of the highest vaccination years across the globe in the last decade. Vaccination rates were converted to a continuous daily rate for use in the model, based on the number of people vaccinated per day, starting from zero people vaccinated.
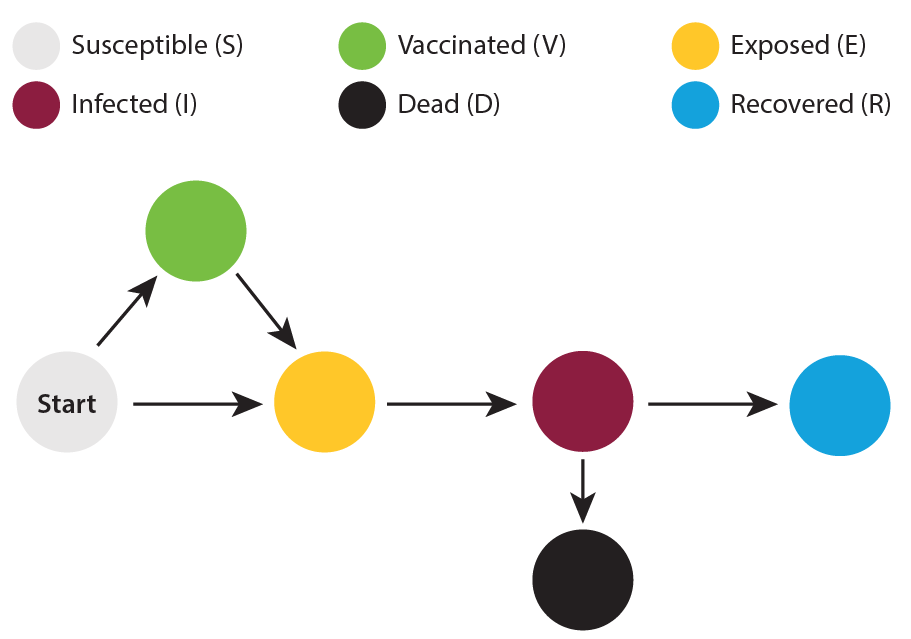
This image was created to help visualize the progression of people between affected groups. Those who are susceptible can either end up being exposed or being vaccinated. Because effectiveness of the vaccine varies, some of those vaccinated can also end up in the exposed group. Exposed individuals become infected, and infection leads to either recovery or death.
NOTE: Only susceptible individuals are eligible to be vaccinated in this model. Those who are exposed, infected, recovered, or dead cannot be vaccinated. This means that as more people are infected, less of the population can receive a vaccine.
For measles, the vaccine is considered 100% effective. The vaccination rate was based on country rates for each selected city, and was assumed to be established, with that number of people already vaccinated.
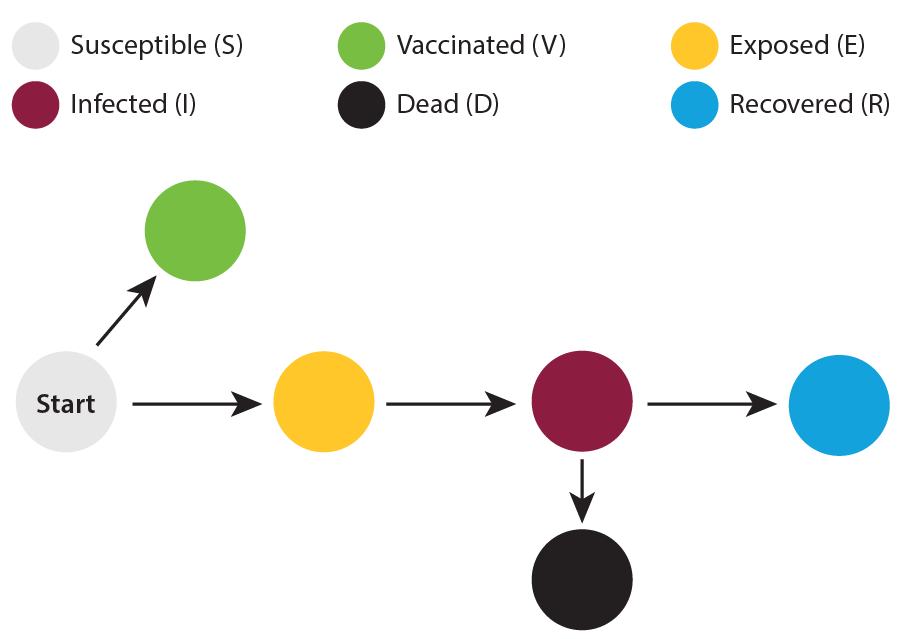
This image was created to help visualize the progression of people between affected groups. Those who are susceptible can either end up being exposed or being vaccinated. Exposed individuals become infected, and infection leads to either recovery or death.
For polio, the vaccine is considered 100% effective. The vaccination rate was based on country rates for each selected city, and was assumed to be established, with that number of people already vaccinated.
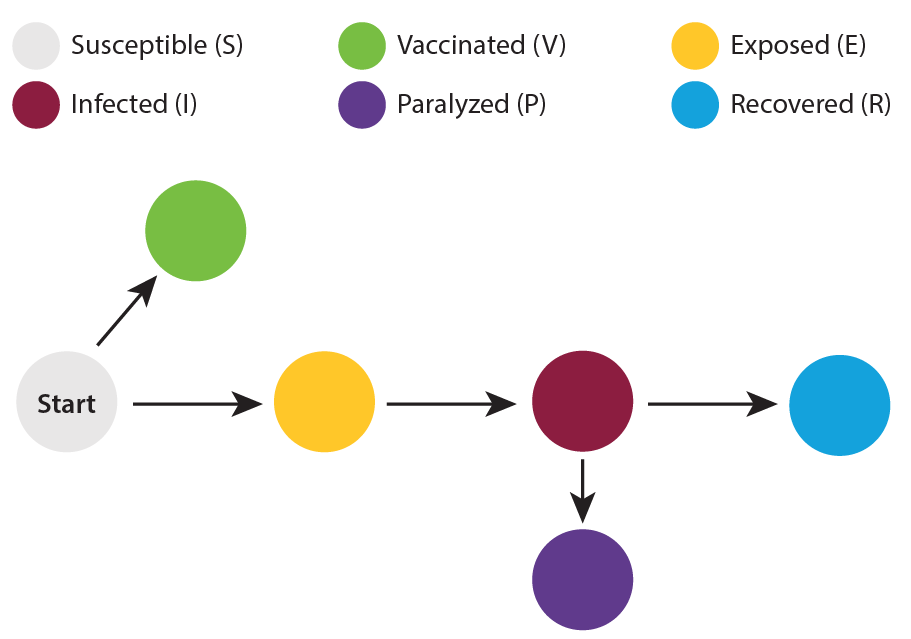
This image was created to help visualize the progression of people between affected groups. Those who are susceptible can either end up being exposed or being vaccinated. Exposed individuals become infected, and infection leads to either recovery or paralysis. Very few (less than 0.05% of infections) result in death after paralysis, so death was not included in the model.
Contact scaling with population size
It takes the minimum city population (10,000) and the largest city population (25 million) and creates a linear multiplier between the two that goes from 0.85 to 1.75. This has the effect of reducing the spread of disease in smaller cities (below 1 on the scale) and increasing the spread of disease in larger cities (higher than 1 on the scale). This helps show the increased contact rates in dense metropolitan areas such as New York City or Shanghai. The contact scaling equation is as follows for a specific population A:
- (population A – minimum population) / (maximum population – minimum population) * (largest scale value – smallest scale value) + smallest scale value.
Using New York’s metro population of around 20 million people as an example, you get:
- (20,000,000 – 10,000) / (25,000,000 – 10,000) * (1.75 – 0.85) + 0.85 = 1.57
So the spread of COVID in New York among asymptomatic and symptomatic people is being multiplied by 1.57 from the base model to show the increase that comes with such a packed metropolitan area.
Parameter info
Birth rates were based on country rates and came from the United Nation’s World Population Prospects and the CIA’s World Factbook.
Death rates were based on country rates and came from The World Bank Group.
The 1918 pandemic flu global death rate came from NCBI’s publication 1918 influenza: The mother of all pandemics.
For COVID-19, a wide range of daily vaccination rates are available, depending on when and where you look. Though vaccination rates often start slowly after a vaccine is available, they often ramp up to higher rates as time goes on. As of the end of February, 2021, three months into vaccines being offered in the US, around 0.4 to 0.5% of the US population was being vaccinated every day. That rate ramped up a bit higher before leveling and dropping down. We selected 0.4% as an overall average daily vaccination rate.
Flu vaccination rates were difficult to find, as data is not always easily available. Flu vaccination rates were based on well-studied H1N1 country-based data and were decided based on various resources, shown in the drop-down link below. Rates were not found for Papua New Guinea, but because PNG generally had the lowest vaccine rates, the rate for flu was matched to Kenya, which had the lowest rates for countries with data available.
- Centers for Disease Control and Prevention
- Publication: High vaccination coverage among children during influenza A(H1N1)pdm09 as a potential factor of herd immunity
- Publication: 2009 pandemic influenza A virus subtype H1N1 vaccination in Africa—successes and challenges
- Publication: A large proportion of the Mexican population remained susceptible to A(H1N1)pdm09 infection one year after the emergence of the 2009 influenza pandemic
- Publication: Cumulative incidence of pandemic influenza A(H1N1) 2009 by a community-based serological cohort study in Selenghe Province, Mongolia
- Publication: The 2009 influenza A (H1N1) pandemic: Management and vaccination strategies in The Netherlands
- Publication: An overview of the 2009 A(H1N1) pandemic in Europe: Efficiency of the vaccination and healthcare strategies
- Publication: Country perspectives: Experiences on pandemic H1N1 vaccine and seasonal influenza vaccine usage in China
- Publication: Low coverage rate and awareness of influenza vaccine among older people in Shanghai, China: A cross-sectional study
- News story: Demand for flu shots, rare in China, spikes amid “Twindemic” fears
- Publication: Seasonal influenza vaccine supply and target vaccinated population in China, 2004-2009
- News story: Chile buys 2 million doses of swine-flu vaccine
- News story: Influenza vaccination is global, but not the same
- News story: Flu surge in Chile, vaccine benefits, H1N2 vaccine uptake, child’s death unsolved, global biotech priorities
Measles and polio vaccination rates came from the World Health Organization’s Immunization Monitoring Global Summary and were based on country rates.
Natural herd immunity
When natural herd immunity is selected, we assume that no vaccinations are available; this is the most drastic and costly form of herd immunity, but represents the situation for many diseases before a vaccine can be developed and distributed.
Model equations and parameters
Here is the model we used and the related parameters:
Learn the latest on the Ask A Biologist COVID-19 vaccines story page.