Data Card Help
Select any highlighted area to learn more about the data card window.
 />
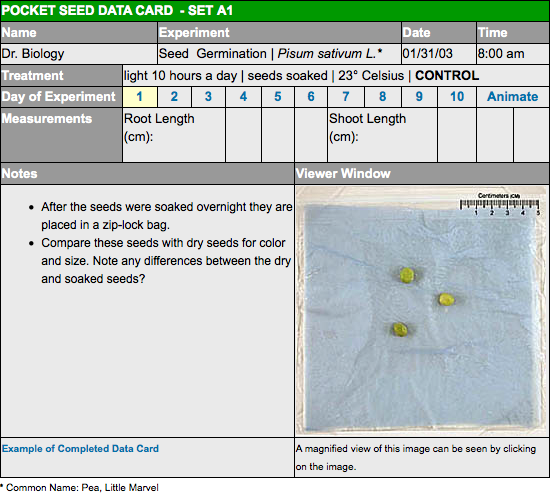
/>Name
This field is for the name of the person running the experiment or treatment. In our case Dr. Biology ran this experiment.
Experiment
This field lists the overall experiment being conducted. Here Dr. Biology lists "seed germination" as the general experiment being conducted.
Date & Time
It is important to take careful notes, which includes the date and time of the experiment and treatment.
Treatment & Controls
This field provides the details for the different treatments (variables) within the overall experiment. There can be many treatments for an experiment. The control is one such treatment. The control is used to test the results of other treatments. Dr. Biology has one control and 9 treatments he is testing.
Hint: When setting up an experiment, be sure to change only one variable for each treatment. This will help you tell the effect of that variable.
Day
Dr. Biology is testing the differences each treatment has over time. Since plants grow slow enough, he chose to record the results each day and at the same time. This keeps yet another variable consistent, time.
How the Day selection windows work.
As you click on the number of the day, the image will change to that day.
Hint: If you click on the image, another viewer window will open. This is a magnified view that will make it easier to measure the changes in the plants from day to day.
Animation
One of the fun things about this experiment is to speed up the process so that you can see the each treatment progress in a few seconds instead of several days. Just click on the animation button to see a 10 day animation. Press the stop button to stop the animation. There is no large window view of the animation.
Measurements
When in the magnified view, each treatment has an on screen measuring tool.
Hint: Internet Explorer (IE) Browsers do not support the measuring tool. If other browsers cannot be used, it is easier to use a piece of string to measure the distance of a root or shoot. This is particularly useful for the curved roots and shoots.
Notes
Dr. Biology has provided a few questions you might answer for each treatment day. Write your answers in the blank notes section of your data cards. You might also think of other information that should be recorded for each treatment.
Hint: This is another place that the magnified viewer window can help.
Viewer Window
On the virtual cards, this window displays the progress for each treatment. On your card, draw the progress of each treatment.
Hint: This is another place that the magnified viewer window can help.
Treatment Viewer Comparison Link
This is a quick link back to the comparison control panel.
Read more about: Dr. Biology's Virtual Pocket Seed Experiment
Bibliographic details:
- Article: Data Card Help
- Author(s): Dr. Biology
- Publisher: Arizona State University School of Life Sciences Ask A Biologist
- Site name: ASU - Ask A Biologist
- Date published:
- Date accessed:
- Link: https://askabiologist.asu.edu/experiments/datacard_help
APA Style
Dr. Biology. (). Data Card Help. ASU - Ask A Biologist. Retrieved from https://askabiologist.asu.edu/experiments/datacard_help
Chicago Manual of Style
Dr. Biology. "Data Card Help". ASU - Ask A Biologist. . https://askabiologist.asu.edu/experiments/datacard_help
Dr. Biology. "Data Card Help". ASU - Ask A Biologist. . ASU - Ask A Biologist, Web. https://askabiologist.asu.edu/experiments/datacard_help
MLA 2017 Style

Be Part of
Ask A Biologist
By volunteering, or simply sending us feedback on the site. Scientists, teachers, writers, illustrators, and translators are all important to the program. If you are interested in helping with the website we have a Volunteers page to get the process started.

