

Does Science Support Social Distancing?
Written by: Kyle Polen, Sarah Weiss
Case: when talking about diseases, each person who has the disease is considered another case.
Case growth rate: the percent by which the number of cases, or people with a disease, increases or decreases.
Contagious: able to be spread by direct or indirect contact with another person or animal.
Extrapolation: in mathematics, a way to estimate that allows researchers to predict results outside of an observed range.
... more
Incubation period: the time during which something develops. For disease, it is the time between coming in contact with a disease and symptoms starting. For animal development, it is the time period that an animal is kept under certain conditions until it hatches or grows to a certain stage.
... more
Mathematical model: a description of a relationship or system that is made using equations. Models can be used to define existing situations or to test hypothetical situations. ... more
What's in the Story?
You’re walking down the aisle of your local grocery store and you see your friend from math class come around the corner. Your natural instinct might be to go up and high five! Right? Not so fast. In a global pandemic, it’s not that easy.

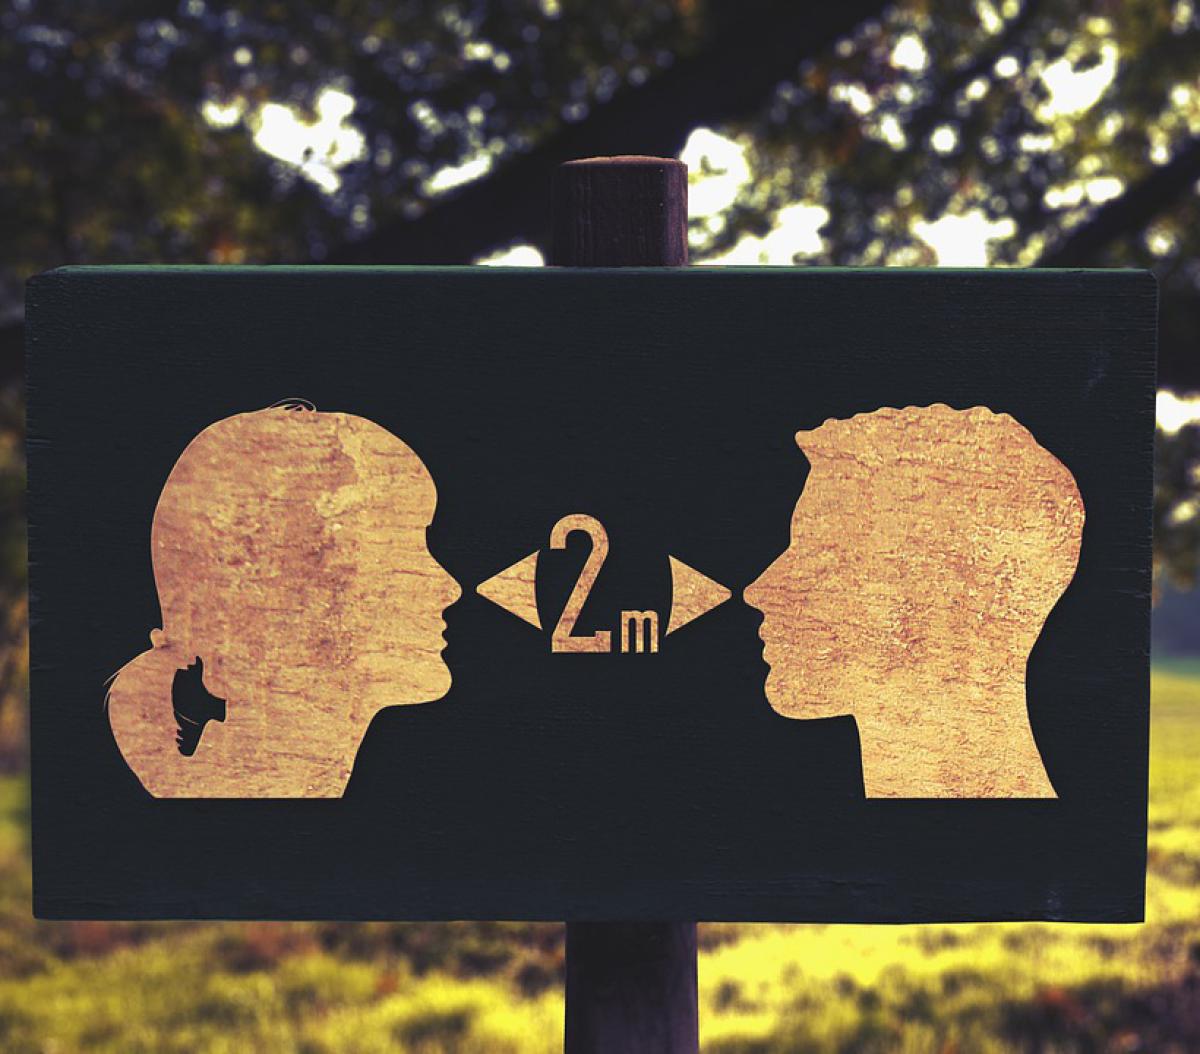
Many diseases that make humans feel sick spread from being near one another. This happens either by touch or through the air in the form of tiny particles from our noses and mouths. Usually, this is something we don’t have to think twice about— you high-five your friend and move on with your day. However, when very contagious diseases spread, it could be better to “socially distance” and wave instead. To know for sure, scientists studied the power of staying apart.
In the PLOS Medicine article, “Social distancing to slow the US COVID-19 epidemic: Longitudinal pretest-posttest comparison group study,” scientists compared U.S. states’ COVID-19 disease data before and after they instituted social distancing policies. These policies included things such as stay-at-home orders or closing schools or workplaces. Their goal was to determine if social distancing can decrease the spread of the disease and save lives.
What is a Coronavirus?
Diseases spread between people all the time, so why is the COVID-19 coronavirus different? The reason is that the virus is extremely contagious and deadly. Viruses are non-living, but like the flu, they infect living organisms to spread. The virus that causes COVID-19 spreads easily through the air, and a person may not feel sick for many days while they are unknowingly spreading it to others. Sometimes, people don’t feel sick at all when they have it.
Hundreds of millions of people have had COVID-19 and millions of people have died. The virus quickly spread around the world to 188 countries and regions (Johns Hopkins Coronavirus Resource Center). Accordingly, countries around the world took action in order to prevent the transmission of the virus.
Flattening the Curve
Between March 10th and 25th of 2020, all 50 of the United States implemented social distancing to fight the COVID-19 pandemic. These changes included things like closing schools, workplaces, public events, and state borders. The goal of these social distancing measures wasn’t to completely stop the virus. That would be virtually impossible.
The real goal behind social distancing was to “flatten the curve.” The idea behind “flattening the curve” is to keep too many people from getting the virus in a short time span. If the graph of people getting sick is “flatter,” this means the spread of the virus is much slower and hospitals won’t become overcrowded. This way, the people who become extremely sick can get the medical care they need.
Big Data Means Big Challenges
In April of 2020, about a month after social distancing started in the U.S., scientists studied how well it worked. First, they collected data from the New York Times COVID-19 database, which shows the number of deaths and total cases. It’s not possible to simply look at this large amount of information and determine a result. Instead, researchers used mathematical models and graphs to find out how COVID-19 infection changed when states locked down.
The scientists’ main goal was to compare the number of cases before and after social distancing was put into place. This meant that they also had to define what “before social distancing” and “after social distancing” meant in each state. For “before social distancing,” the scientists included everything from 14 days before to 4 days after its start.
Why would they include the 4 days after, you might ask? This is because of the “incubation period,” which is the time between when you get exposed to a virus and the time you start to show symptoms. For COVID-19, the incubation period is on average about 4 days, so benefits of social distancing would not be seen right away.
For “after social distancing,” the scientists included everything from 4 to 21 days after its start. This 21-day limit was used because some states actually removed some social distancing rules after three weeks had passed.
Working Together by Staying Apart
Before social distancing, the number of COVID-19 cases was increasing by 30.8% daily. The scientists called this the daily case growth rate. They found that after the fourth day of social distancing, the daily case growth rate decreased by 0.9% each consecutive day.
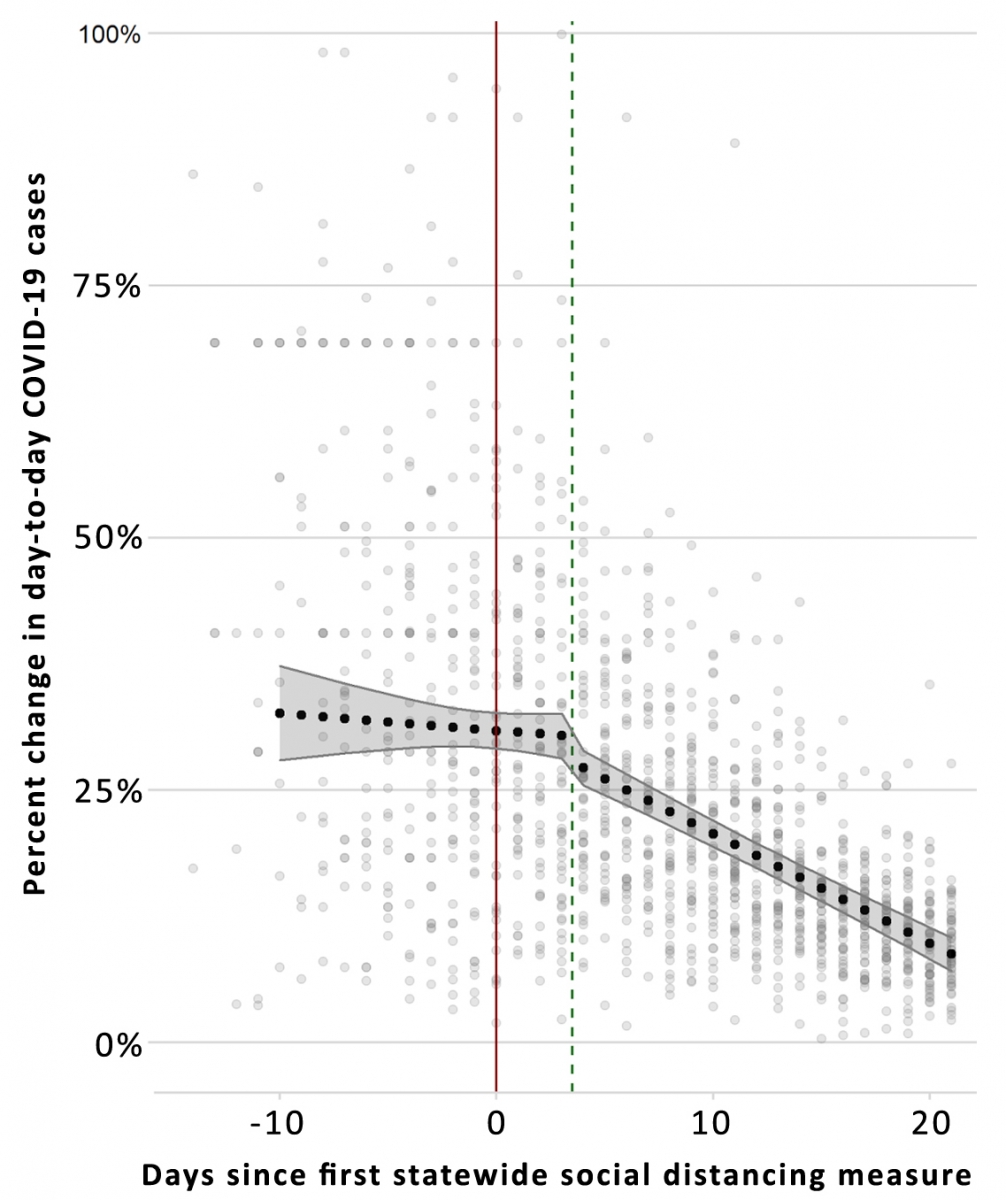
While 0.9% per day might not sound like a lot, in the scientists’ mathematical model, it made a huge difference. The 0.9% daily decrease meant that there were over 1,600 fewer new coronavirus cases within 7 days of starting social distancing. There were over 55,000 fewer new cases after 14 days, and there were over a whopping 621,000 fewer new cases within 21 days.
These are all good signs that social distancing helped, but scientists needed to “extrapolate” their data to find out how much it helped. Extrapolation consists of using previous data to predict the future. Scientists used data points from the past to estimate what would have happened if social distancing was not used to combat COVID-19. After 21 days of social distancing, there were approximately 283,161 reported cases of COVID-19 in the US. Scientists believe there would have been 904,773 cases with no social distancing.

This means that social distancing was effective in slowing the spread of the virus. Thanks to all this data, we confirmed that social distancing was a good idea after all. In fact, we probably should have started it sooner.
You may need to edit author's name to meet the style formats, which are in most cases "Last name, First name."
https://askabiologist.asu.edu/plosable/science-of-social-distancing
Bibliographic details:
- Article: Does Science Support Social Distancing?
- Author(s): Kyle Polen, Sarah Weiss
- Publisher: Arizona State University School of Life Sciences Ask A Biologist
- Site name: ASU - Ask A Biologist
- Date published:
- Date accessed:
- Link: https://askabiologist.asu.edu/plosable/science-of-social-distancing
APA Style
Kyle Polen, Sarah Weiss. (). Does Science Support Social Distancing?. ASU - Ask A Biologist. Retrieved from https://askabiologist.asu.edu/plosable/science-of-social-distancing
American Psychological Association. For more info, see http://owl.english.purdue.edu/owl/resource/560/10/
Chicago Manual of Style
Kyle Polen, Sarah Weiss. "Does Science Support Social Distancing?". ASU - Ask A Biologist. . https://askabiologist.asu.edu/plosable/science-of-social-distancing
Kyle Polen, Sarah Weiss. "Does Science Support Social Distancing?". ASU - Ask A Biologist. . ASU - Ask A Biologist, Web. https://askabiologist.asu.edu/plosable/science-of-social-distancing
For more info, see http://owl.english.purdue.edu/owl/resource/717/04/
MLA 2017 Style
Modern Language Association, 7th Ed. For more info, see http://owl.english.purdue.edu/owl/resource/747/08/
During the COVID pandemic, social distancing changed our lives. Take a closer look at how well this safety measure works when used correctly.
To see the effect of social distancing, mask wearing, and vaccination on a large scale, check out COVIDsim.
Be Part of
Ask A Biologist
By volunteering, or simply sending us feedback on the site. Scientists, teachers, writers, illustrators, and translators are all important to the program. If you are interested in helping with the website we have a Volunteers page to get the process started.