
About Sonograms
| They may look like abstract paintings, but for scientists, sonograms are wonderful tools used to understand sounds and the animals that create them. So, what is a sonogram and how do scientists use them to study sounds? This brief discussion will shed some light into the world of sounds and sonograms. |
|
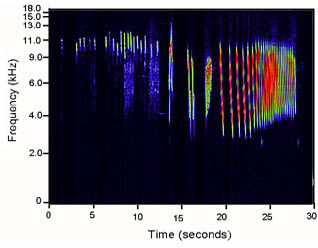
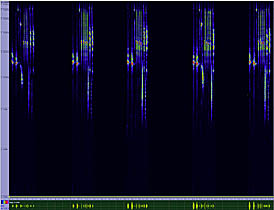
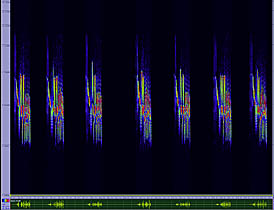
| A sonogram is a representation of a sound shown on an x-y graph. On this graph, the vertical (y) axis represents the frequency or pitch of the sound expressed in kilohertz (kHz).
As an example, the sound from a piccolo is at a higher frequency than say the sound from a tuba. Humans, and apparently most birds, can hear sounds of up to approximately 20 kHz. |
|
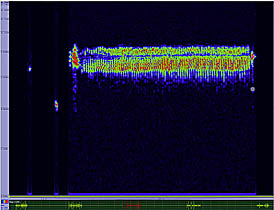
Knowing the frequency and the time interval that each sound is made helps you to visually see what you are hearing. In many cases you can learn much more from a sonogram of a birdcall than by just listening to it. What about all those colors?The other important part of the sonograms produced from the bird recordings are the colors. The rainbow of colors show how loud each frequency is being produced. The louder the sound the closer it reaches the red range. Very low sounds are in dark blue. Color-coding of sound intensity is very useful to understand how it varies within a given sonogram. However, you need to remember that intensity of a sound decreases as the source of this sound is further away. Because sonograms are created from recordings made at variable distances from the source of the sound (the bird itself), the intensity of the sound represented in two different sonograms cannot be directly compared. The same song will be recorded as increasingly fainter the further the distance from the bird.
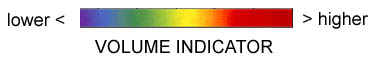
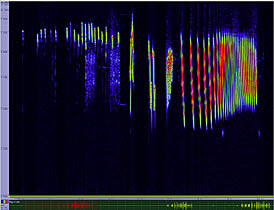
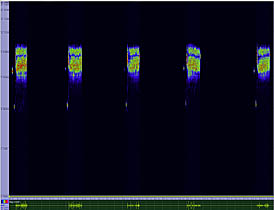
You can see in the following two sonograms, that the song of many species consists of a rapid alternation of low and high frequency notes.The horizontal (x) axis of the sonogram shows time in seconds. Some bird songs are mostly slow and others can be very fast. If you look at the sonogram of the Grasshopper Sparrow song (see below), you will notice that it consists of short introductory notes followed by a long trill. This trill sounds like a cricket or small grasshopper call, and that is where its name comes from.A person can use this sonogram to calculate that the interval between two notes (shown as vertical bars) in the trill is about 20 msec or a 50th of a second! Grasshopper Sparrows and other animals such as and crickets produce sounds at this very high cadence, much higher than humans can produce. Because the interval between trill notes is so short, one could not measure it simply by listening to the song.Sonograms are often color-coded to represent the sound intensity (or loudness). Accordingly blue represents a low intensity sound and orange and red represent high intensity sounds.
|
|
|
|
Read more about: Birds and Their Songs
You may need to edit author's name to meet the style formats, which are in most cases "Last name, First name."
https://askabiologist.asu.edu/sonograms
Bibliographic details:
- Article: Sonograms
- Author(s): Dr. Biology
- Publisher: Arizona State University School of Life Sciences Ask A Biologist
- Site name: ASU - Ask A Biologist
- Date published:
- Date accessed:
- Link: https://askabiologist.asu.edu/sonograms
APA Style
Dr. Biology. (). Sonograms. ASU - Ask A Biologist. Retrieved from https://askabiologist.asu.edu/sonograms
American Psychological Association. For more info, see http://owl.english.purdue.edu/owl/resource/560/10/
Chicago Manual of Style
Dr. Biology. "Sonograms". ASU - Ask A Biologist. . https://askabiologist.asu.edu/sonograms
Dr. Biology. "Sonograms". ASU - Ask A Biologist. . ASU - Ask A Biologist, Web. https://askabiologist.asu.edu/sonograms
For more info, see http://owl.english.purdue.edu/owl/resource/717/04/
MLA 2017 Style
Modern Language Association, 7th Ed. For more info, see http://owl.english.purdue.edu/owl/resource/747/08/

With Bird Finder you can locate and learn about birds in the southwest. The collection has almost 300 birds. There are images, range maps, and their songs and calls. You can also select and compare different birds.
Be Part of
Ask A Biologist
By volunteering, or simply sending us feedback on the site. Scientists, teachers, writers, illustrators, and translators are all important to the program. If you are interested in helping with the website we have a Volunteers page to get the process started.